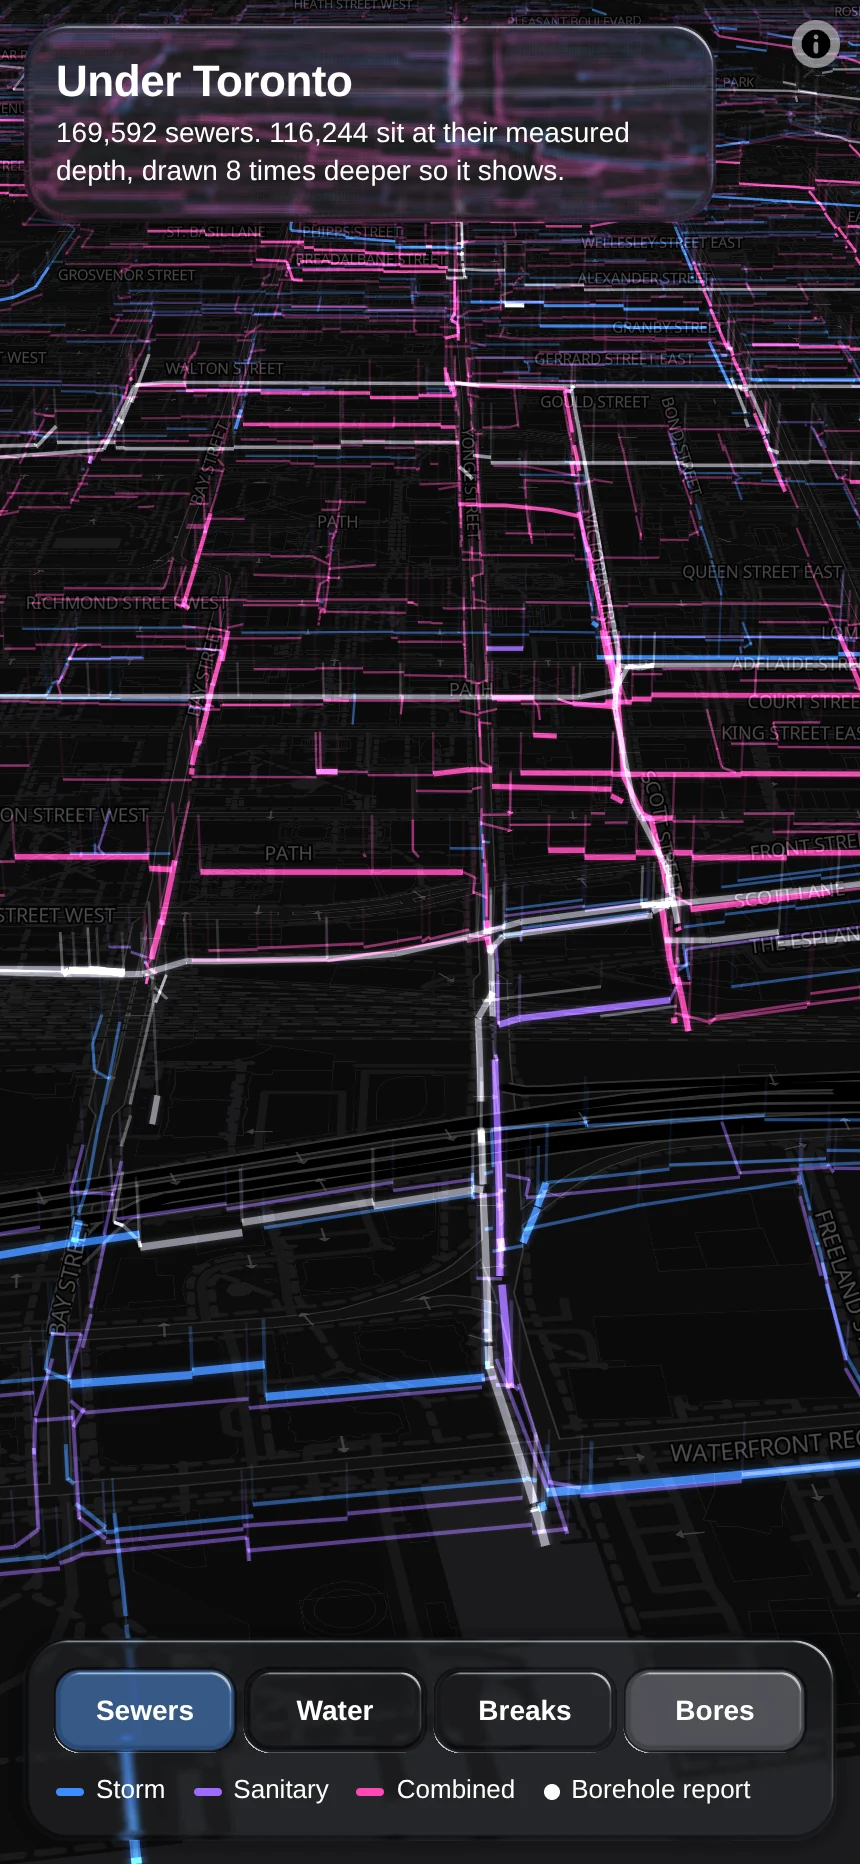
Toronto publishes where every sewer and watermain runs. For most sewers it also publishes two elevations: the top of the maintenance hole and the bottom of the pipe. Subtract one from the other and you have how deep the pipe is.
This map draws 169,592 sewers that way, eight times deeper than they are so the depth can be seen, with a line down from each maintenance hole.
The white dots are foundation reports from the ministry that built the highways; tap one to read it.
What's inside
- A build step packs 240 MB of city files into about 7 MB: eight bytes a vertex.
- One WebGL layer draws all of it below the map's ground plane, each pipe as a ribbon with a real width, so the lines thicken as you move in. Nothing animates, so a still map uses no power.
- It is the first app built on the map kit's parts: the map defaults, loading before showing, and the opening move come from the kit.